Interactive data exploration
Click here to view the osmFISH data in the loom viewer.
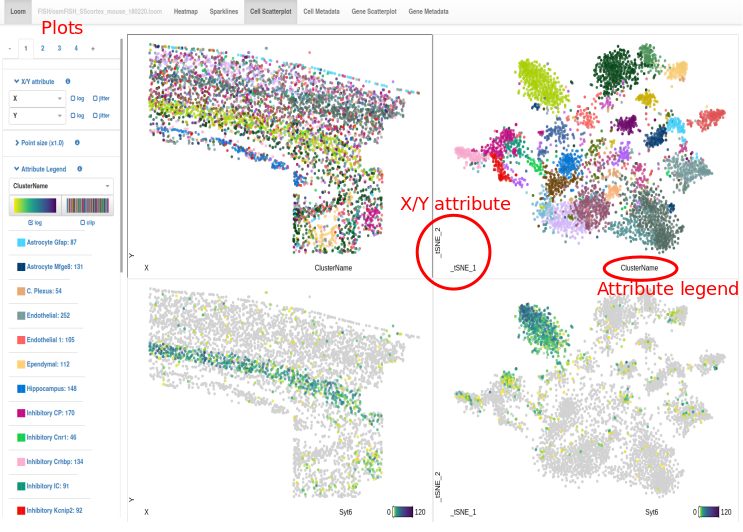
The Loom Viewer is a tool to quickly visualize single-cell transcriptomics datasets that are stored in the loom file format. Loom files store gene expression data for each cell, along with attributes for each gene and each cell (read more about loom and the loom viewer). If you go to the loom viewer you will see four scatterplots. The left two plot the X and Y coordinates of each cell that are stored as cell attributes, showing you the position of the cells in the tissue. Similarly, the right two plots show the tSNE coordinates for each cell.
The top two plots are colored by the clusters so that you can see the location of each cluster in the tissue and in the tSNE plot simultaneously. The bottom two plots show the expression levels of the gene Syt6, which was used as a marker of Layer 6 pyramidal neurons.
If you want to explore the dataset, please select the plot by clicking on it and change the X/Y attribute to change the layout of the plot. Then, change the attribute legend to visualize any of the attributes. Change between the continuous and categorical scale to match the data type.
On top you can select different ways of plotting the data. Head over to the Sparklines if you want to study the gene expression over the different categories, or go to the heatmap to see an overview of the expression over all cells.